As Delaware’s 2024 General Election heats up, early voting data shows a strong voter turnout, with both early in-person and mail-in ballots contributing to a dynamic early voting landscape. To date, Delawareans have cast a total of 111,916 early votes, with a significant portion, 81,315, being in-person ballots.

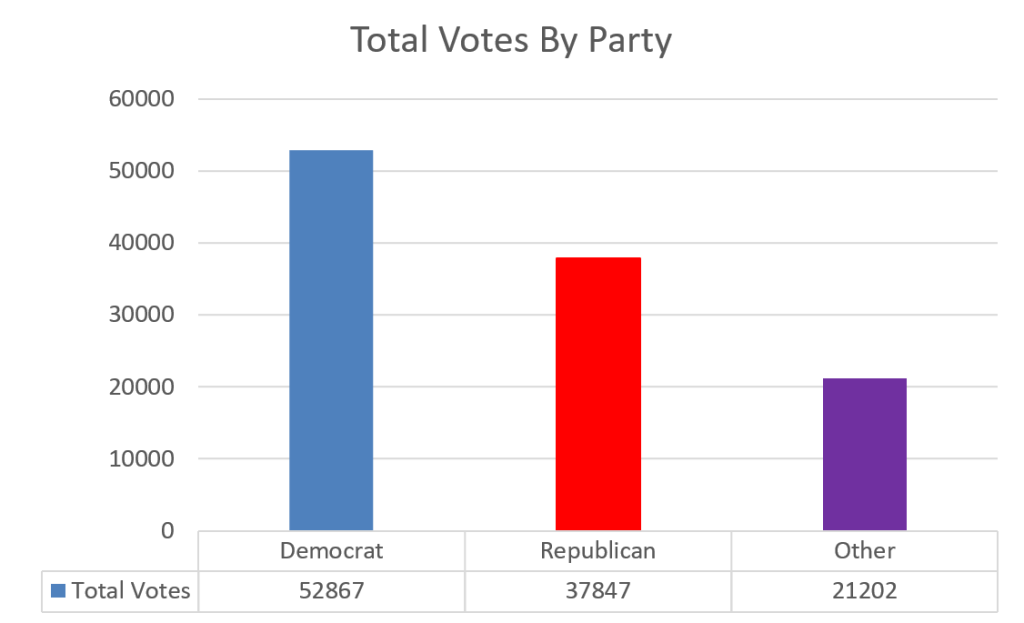
Above Chart –Democratic Party voters have cast 52867 total votes in early and mail-in voting, Republicans 37847 and unaffiliated 21202.
Early In-Person Voting Turnout by Party
When examining early in-person returns by party, the data indicates that registered Democrats have cast 34,904 votes of the 81,315 votes counted in the first four days of early voting. This represents 42.9% of all early in-person ballots cast. Republicans are close behind with 30,533 early in-person votes. Other or no party voters cast 15.878 votes in early -in-person voting. There is no way of knowing who any of these voters voted for. That information will be available after the 8:00pm November 5.

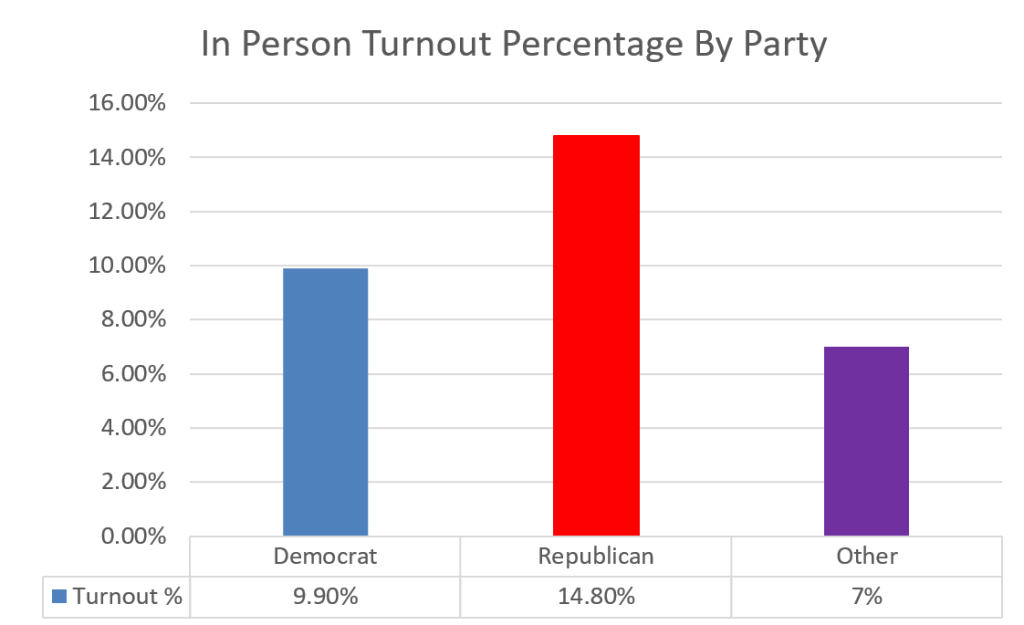
Above Chart –Democratic Party: Out of 353,212 registered voters, 34,904 have cast in-person votes, resulting in an in-person party turnout of approximately 9.9% – Republican Party: Out of 206,770 registered voters, 30,533 have cast in-person votes, resulting in an in-person party turnout of approximately 14.8%. – Other or No Party Affiliations: With 226,595 registered voters, 15,878 have cast in-person votes, resulting in an in-person party turnout of approximately 7%.
Mail-In Voting Turnout by Party
Delaware voters requested 46,126 mail ballots, and as of October 29, 2024, 30,601 of these ballots have been returned. This reflects a return rate of 66.3%,
Looking at mail-in ballot returns by party, the data indicates that registered Democrats have submitted the majority of returned mail ballots, with 17,963 accepted ballots. This represents 58.7% of all returned mail ballots. Registered Democrats requested a total of 26,770 mail-in ballots. Republican ballots make up just under 24% of mail-in ballots with a total of 7,314 returned. Voters in other or no party came in at 17.4% with 5,325 mail-in ballots received so far.
Breakdown of Voter Turnout Percentages by Party
To contextualize these figures within the total registered voter base, let’s analyze the turnout percentages based on Delaware’s registered voters for each party.
- Democratic Party: Out of 353,212 registered voters, 34,904 have cast in-person votes, resulting in an in-person turnout of approximately 9.9%.
- Republican Party: Out of 206,770 registered voters, 30,533 have cast in-person votes, resulting in an in-person turnout of approximately 14.8%.
- Other or No Party Affiliations: With 226,595 registered voters, 15,878 have cast in-person votes, resulting in an in-person turnout of approximately 7%.
- Democratic Party: Out of 353,212 registered voters, 17,963 mail ballots were returned, resulting in a mail-in turnout of approximately 5.1%.
- Republican Party: Out of 206,770 registered voters, 7,314 returned mail ballots, translating to a mail-in turnout of approximately 3.5%.
- Other or No Party Affiliations: With 226,595 registered voters, 5,324 ballots returned represent a mail-in turnout of approximately 2.4%.

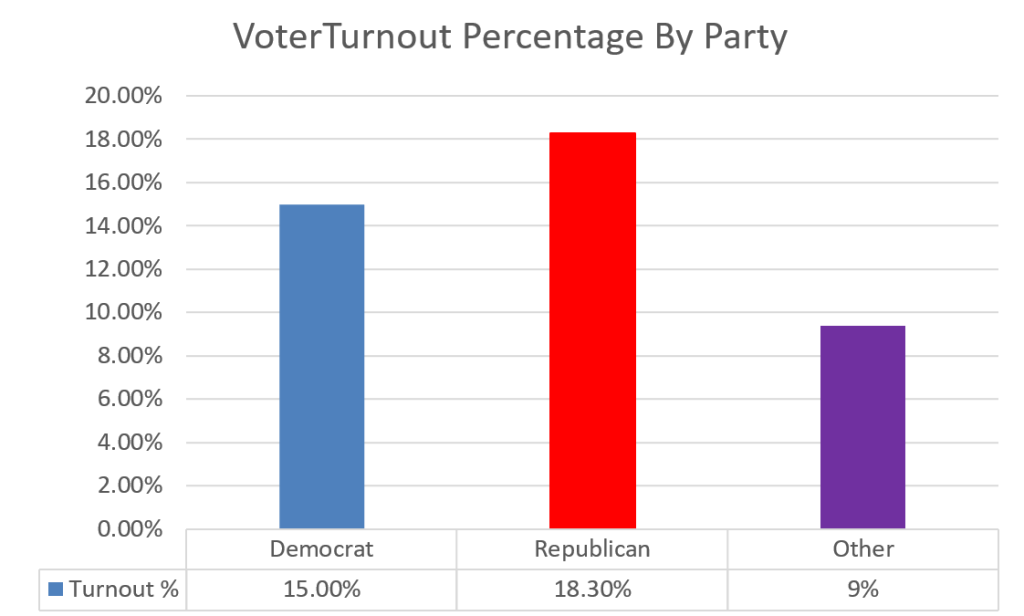
Above Chart -Democratic Party: 52,867, 15%, of 353,212 Registered Voters have cast a vote so far – Republican Party: 37,847, 18.3% of 206,770 Registered Voters have cast a vote so far – Other or No Party Affiliations: 21,202, 9%, of 226,595 Registered Voters have cast a vote so far.
Summary of Key Points
- Total early votes: 111,916
- In-person: 81,315
- Mail-in ballots returned: 30,601 (out of 46,126 requested)
- Mail ballot return rate: 66.3%
- Breakdown of mail ballot returns by party:
- Democratic Party: 58.7% of returned mail ballots, 5.1% turnout for party
- Republican Party: 23.9% of returned mail ballots, 3.5% turnout for party
- Other/No Party: 17.4% of returned mail ballots, 2.4% turnout for party
- Democratic Party: 42.9% of in-person turnout, 9.9% turnout for party
- Republican Party: 37.5% in-person turnout, 14.8% turnout for party
- Other/No Party: 19.5% of in-person turnout, 7% turnout for party
The data does not indicate who the voters voted for or if there was any cross party voting. These are simply the raw numbers.

